
Although this is a golf blog, today I’m going to talk about the NFL. This is not a random aside that has no connection to golf, but rather the hype and hysteria of the most popular US sport presents a good example of why using a model is a useful way to avoid overreacting.
I am a huge fan of the Minnesota Vikings. Last year they were devastatingly close to playing in the Super Bowl at their home stadium. This year they upgraded their quarterback by signing Kirk Cousins, and their defense looked to be at least as good as it was last year. After starting 1-0-1, they played the seemingly listless Buffalo Bills last Sunday at home, where they were favored by 16.5 points – one of the largest margins in the league. Things did not go according to plan – the Vikings not only lost, but lost 27-6 in the greatest upset since 1995.
There are a lot of lessons that can be learned by asking why the predictions about this game aligned so poorly with reality. Why were the Vikings favored by so much? Was the point spread justified? Were there any clues that might have pointed to an overestimation of the Vikings’ skills and an underestimation of the Bills’?
I believe the magnitude of this miss is due to a lack of rigor in prediction making, and that learning how to use models to inform decision making would help anyone make better predictions in golf, football, gambling, or elsewhere.
Why a model is useful
Recall from an earlier post I discussed some of the key features mathematical modeling:
- Models always have assumptions built in to simplify the problem — it is important to be aware of when these assumptions are valid.
- No model is perfect, and there are certain points where the model will break down.
- Using models we can gain insight into why the world behaves the way it does.
- Models can help us answer more complicated questions.
Although models are very useful, they are not a panacea. Their data-driven approach provides some objectivity, but their assumptions inherently neglect relevant effects. If I am playing a hole that is psychologically challenging or does not fit my eye, these factors should no doubt influence my strategy even if they are not a part of the model. To say that a person should blindly adhere to a model’s predictions is far too simplistic and naive for making real world decisions.
However, even when contradicting a data-driven prediction, models are still useful because they require a person to explain why he or she believes the model is not correct. Specifically, a person must state which assumptions in the model are invalid and why a different assumption may lead to different results. Another way to put it: if a person believes all assumptions within the model are true, then he or she must by definition believe the model’s results are true, regardless of how unconventional they are. For these results to be false, there must be a false assumption, and clearly stating this assumption provides a rigorous way to disagree with the model results.
Consider for example, the Hardy Model from a previous post, in which a player can hit 3 types of shots: excellent, normal, or bad. I discussed how this model finds that a consistent player wins more matches than an erratic player because the erratic player occasionally hits a bad shot when a normal one would have finished the hole. This model makes a number of assumptions, and you might disagree with the results, but in order to make a strong case for why the erratic player might be better, it is best to explain why invalidating a particular assumption will lead to a different result.
You could take issue with the simplicity of only 3 types of shots. A round of golf, after all, consists of a variety of shots beyond just normal, excellent, and bad. However, on its surface, it is not apparent to me why a continuum of shot quality would significantly change the results. After all, the reason a consistent player performed better was because she did not miss many “short putts” – a fact that probably would not change if the 3-type assumption were false.
A better criticism is with the assumption that the probability of hitting an excellent or bad shot is constant for every attempt. We know that in real life players will be aggressive or conservative depending on the situation. More importantly, we showed in the “Smart Hardy Model” that if everyone is more conservative on those “short putts,” the consistent player’s advantage goes away (and the erratic player has an advantage in match play). Thus if you believe that tap-ins are treated more cautiously than other shots, you would be justified in contradicting the results of the model.
To summarize, the benefit of a model is not only its results, but in the enumeration of its assumptions. Sometimes it is worth neglecting the model, but disagreement must be justified by evaluating the validity of the model’s assumptions.
Availability and the NFL
So what happened in the Bills-Vikings game last weekend, and why was the predicted spread so large? Well the Vikings were still believed to have the same stalwart defense they had last year, and with Kirk Cousins at quarterback and running back Dalvin Cook returned from knee injury, their offense appeared to be upgraded. These assumptions were validated when the defense produced a fumble and 3 interceptions (one returned for a touchdown) against the up-and-coming San Francisco 49ers, and when the offense scored 22 points in the fourth quarter to come from behind and tie the Green Bay Packers.
The Bills, on the other hand, lost their first game to the Baltimore Ravens 47-3, and lost their second game to the LA Chargers 31-20. At halftime in the Chargers game, cornerback Vontae Davis announced his retirement, refusing to play the second half. Head Coach Sean McDermott took away play-calling duties from Defensive coordinator Leslie Frazier. These are the stories a team generates when they are heading toward a dismal season.
It is within this context that the Vikings were favored by 16.5 points against the Bills. But is that spread justified? Without a model to help anchor our predictions, we are left to react emotionally, which psychology and behavioral economics has shown is prone to numerous biases.1
In particular, studies have shown that humans are prone to make decisions based on the Availability Heuristic, which states that we consider an outcome to be more likely if it is easier to imagine it happening. With all of the turmoil in the Bills’ locker room and the recent explosive performances of the Vikings’ offense and defense, it is very easy to imagine a one-sided Vikings victory, and it is very hard to imagine a scenario in which the Bills dominate.
The Availability Heuristic highlights the difference between plausibility and probability. An outcome that seems very plausible does not necessarily mean it is very probable. A cautious hiker might be able to easily imagine numerous dangers on the trail and consider those risks to be much more likely than a carefree hiker who has trouble envisioning any problems. In reality the probability of the hikers finding trouble has nothing to do with their mindsets, even though the cautious hiker will no doubt assign higher probability to danger.
The Availability Heuristic implies that events that occurred recently (Bills’ lackluster first two games) or were incredibly memorable (the Minneapolis Miracle) will more strongly influence our perceptions because they come to mind more easily. It appears very plausible that the Vikings will win by a large margin, but without a model, our predictions are likely to be unknowingly biased.
A Bayesian Football Prediction
One way to more rigorously predict the quality of the Bills and Vikings is to use Bayesian Inference in a similar manner as discussed in the last post. To recap, Bayesian Inference is the rigorous method by which statisticians and data scientists update their predictions when presented new information. This way of thinking assumes that we approach each situation with prior beliefs about various possible outcomes, and then we update those beliefs based on both how strong those prior beliefs are and how much the new evidence aligns with those predictions.
Suppose we want to adjust our predictions about how many games each team will win based on their record after two games. In order to adequately use Bayesian Inference, we need a prior probability distribution for how likely we would predict different outcomes before the season started. As stated previously, there isn’t a rigorous way to determine the prior distribution – we must decide how we will weight the relative likelihoods.
One way to generate a prior distribution is to assume that a team’s odds of winning are the same as the fraction of wins they had last season. The Vikings last year were 13-3, so let’s build our prior by assuming in every game the Vikings chances of winning are 13/16 = 81%. With this assumption, their prior probabilities for this season are plotted below:
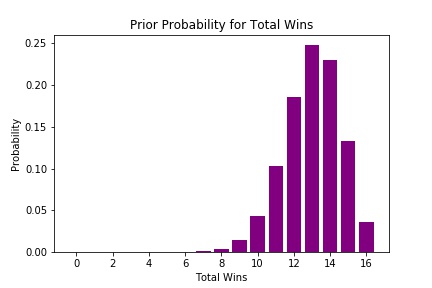
This prior almost certainly overestimates the chance of a high win season, since it predicts a greater than 5% chance of going 16-0 (which has only been done once), but it is not terribly inconsistent with analysts’ preseason predictions, many of which had the Vikings as Super Bowl favorites.
Many people forget that the Bills went to the playoffs at 9-7 last season. If we assume they win games at a rate of 9/16 = 56%, their prior probability distribution looks like this:
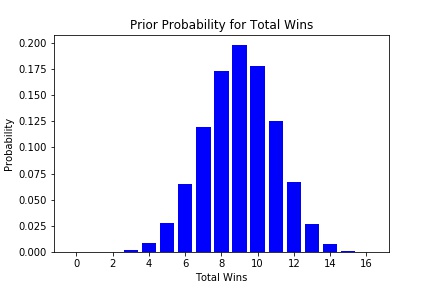
Knowing nothing except that the Bills were 9-7 last year, we would expect that they would probably win between 5 and 13 games, with 9 wins as the modal outcome (most common).
Let’s consider how these probabilities change after the first two weeks of the season. To simplify the calculations, I will treat the Vikings’ tie with the Packers as a loss. Using Bayes’s Theorem in the same manner as the last post, here are Vikings’ posterior probabilities after winning one of their first two games:
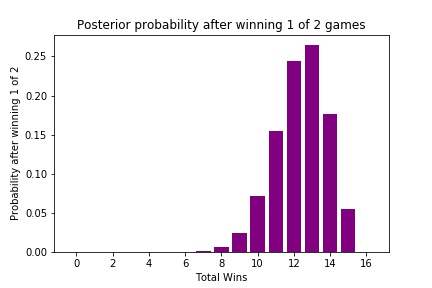
As you can see, the Vikings probabilities have shifted slightly, since winning 15 games now requires near-perfect performance. However, because our prior probability heavily weighted the odds of a high win season, the Vikings are still given a high likelihood of winning more than 10 games.
Here are what the Bills’ posterior probabilities look like after starting 0-2:
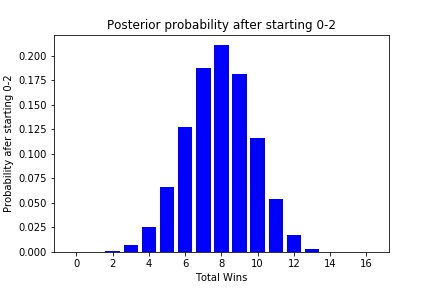
The Bills’ chances have also shifted down, but because there have only been two games and based on our priors, there is still a roughly 50% chance that the Bills will have a winning record.
This analysis does not by itself predict how the Bills will do against the Vikings, but it does provide some context with which to make our prediction. Instead of asking about the Bills and Vikings themselves, I might ask: how likely is it that a team that wins 6-10 games will beat a team that wins 11-14 games? You would expect the 11-14 win team to be victorious, but it would not be completely shocking if they lost.
Breaking from Predictions, Anchoring, and Updating
I chose the model above for predicting total wins because it was simple and was very similar to predicting greens hit in my last post. However, as with every model, it is not perfect, and its simplicity means it contains a number of assumptions. In particular, it does not address a team’s offseason moves, opponent strength, or the quality of a win or loss.
A much better predictor of NFL performance is FiveThirtyEight’s ELO model. This model not only provides more information such as individual game predictions, playoff chances, and Super Bowl odds, but it incorporates a number of factors my simple prediction above ignores:
- It includes a regression to the mean after each season
- It predicts win probabilities based on the overall strength of each team
- It adjusts its rankings and predictions based on how unexpected the result is an the margin of victory
While this model is exceptionally strong, like all models it makes several assumptions. Most notably, it ignores the details of a specific team’s makeup – any new trades, coaches, or injuries are not directly incorporated (last year the model overestimated the win probability for several Packers games since it did not know Aaron Rodgers was injured).
Despite these limitations, this model provides an excellent starting point for predicting a game, and if we decide to break from the model, we can do so in a more rigorous way. Before the Bills-Vikings game, the FiveThirtyEight model favored the Vikings by 9 points, giving them a 78% chance of winning the game.
This spread is noticeably more favorable to the Bills than the 16.5 point spread set by Vegas oddsmakers. It is certainly reasonable that the model is not correct, but we must be careful in addressing what reasons we have to believe the model has it so wrong. Since the FiveThirtyEight model does not account for the apparent chaos of the Bills’ locker room, we might predict that the spread is low and that the Vikings should be favored by more. We may also say that the Vikings “looked better” than the final score may have shown, and that the Bills “looked worse.” Apart from that, I see no reason to believe that the FiveThirtyEight model is wrong – it accounts for the good Vikings season from last year and the Bills’ dreadful start.
It seems reasonable that the Vikings should have been favored by more than 9 points against the Bills, but is it really so believable that the FiveThirtyEight spread was off by 7.5 points just because of the Bills’ drama and the “look” of the games? Probably not. It seems more likely that everyone bought into the hype surrounding the two teams and overestimated the Vikings’ chances. Of course, we now know that the Vikings were pummeled by the Bills, which even by the FiveThirtyEight model was unlikely, but it probably was less unlikely than conventional wisdom predicted (consider that even as 9 point underdogs, the model predicted the odds of the Bills winning as barely worse than correctly guessing two coin flips).
This week we may be seeing a similar overreaction to the Vikings’ dreadful performance as we predict their odds against the LA Rams tonight. The FiveThirtyEight model favors the Rams by 4 points, with a 65% chance of winning. As of this writing, the betting odds favor the Rams by 7 points, with a roughly 77% chance of winning. Obviously the sloppy performance of the Vikings at home suggests they may not be as good as we originally thought, but the FiveThirtyEight model has already accounted for this. You may want to favor the Rams more than the model based on the short week of preparation and the fact that Vikings DE Everson Griffen is not playing, neither of which are accounted for in the model. The question is how much you feel these considerations are worth in deviating from the model. (UPDATE: The Rams won by 7)
More notably, the FiveThirtyEight model has the Packers as 1 point favorites against the Bills this weekend, while the oddsmakers favor the Packers by 10! This is an even higher difference in spread than the Bills-Vikings game was last week. If you believe the Vegas odds, you must ask what assumptions the FiveThirtyEight model is making incorrectly, and why these assumptions favor the Bills by so much. Is there truly a reason to favor the Packers by so much, or is this just hype? (UPDATE: The Packers won 22-0)
Applying it to golf
The lesson here is that although models are not perfect, they provide context for making predictions, even if those predictions deviate from the model. When making a new prediction, we must be aware of exactly why we think the model is wrong, and the process of enumerating those reasons helps avoid overreacting and succumbing to the Availability Heuristic.
This blog and other resources provide a number of models for course management, strategy, and tournament preparation. Blindly believing these models without question neglects the significance of player intuition. It can be challenging to decide when breaking from a model is warranted and when it is just wishful thinking. A good approach is to recognize ahead of time what assumptions the model is making, and then consciously address why these assumptions are insufficient for this particular case.
-
See Thinking Fast and Slow by Daniel Kahneman (Allen Lane 2011) ↩